Running automated workflows without proper monitoring is like driving blindfolded: you might reach your destination, but you'll never see the problems coming until it's too late. For operations managers and IT teams managing critical business processes through n8n, workflow monitoring isn't just a nice-to-have feature; it's essential infrastructure that prevents costly downtime and ensures your automations deliver consistent results.
When workflows fail silently, the consequences ripple through your organization. Customer emails go unanswered, invoices aren't processed, and data synchronization breaks down without anyone noticing until it's too late. That's why setting up comprehensive monitoring and alerting systems should be your first priority after deploying any n8n workflow to production.
Why Workflow Monitoring Matters for Business Operations
Modern businesses rely on automated workflows for everything from customer onboarding to financial reporting. A single failed workflow can cascade into missed deadlines, frustrated customers, and revenue loss. Effective monitoring provides three critical benefits: early problem detection before issues impact end users, performance optimization through data-driven insights, and compliance documentation for audit requirements.
The good news? N8n offers multiple monitoring approaches that scale from simple execution logs to enterprise-grade observability platforms. You can start with built-in features and gradually implement more sophisticated monitoring as your automation infrastructure grows.
Leveraging N8n's Built-in Execution Logs
Your first line of defense is n8n's native execution logging system. Every workflow run creates a detailed record showing exactly what happened at each step, including input data, output results, and any error messages. The execution dashboard provides a chronological view of all workflow runs, making it easy to spot patterns and identify recurring issues.

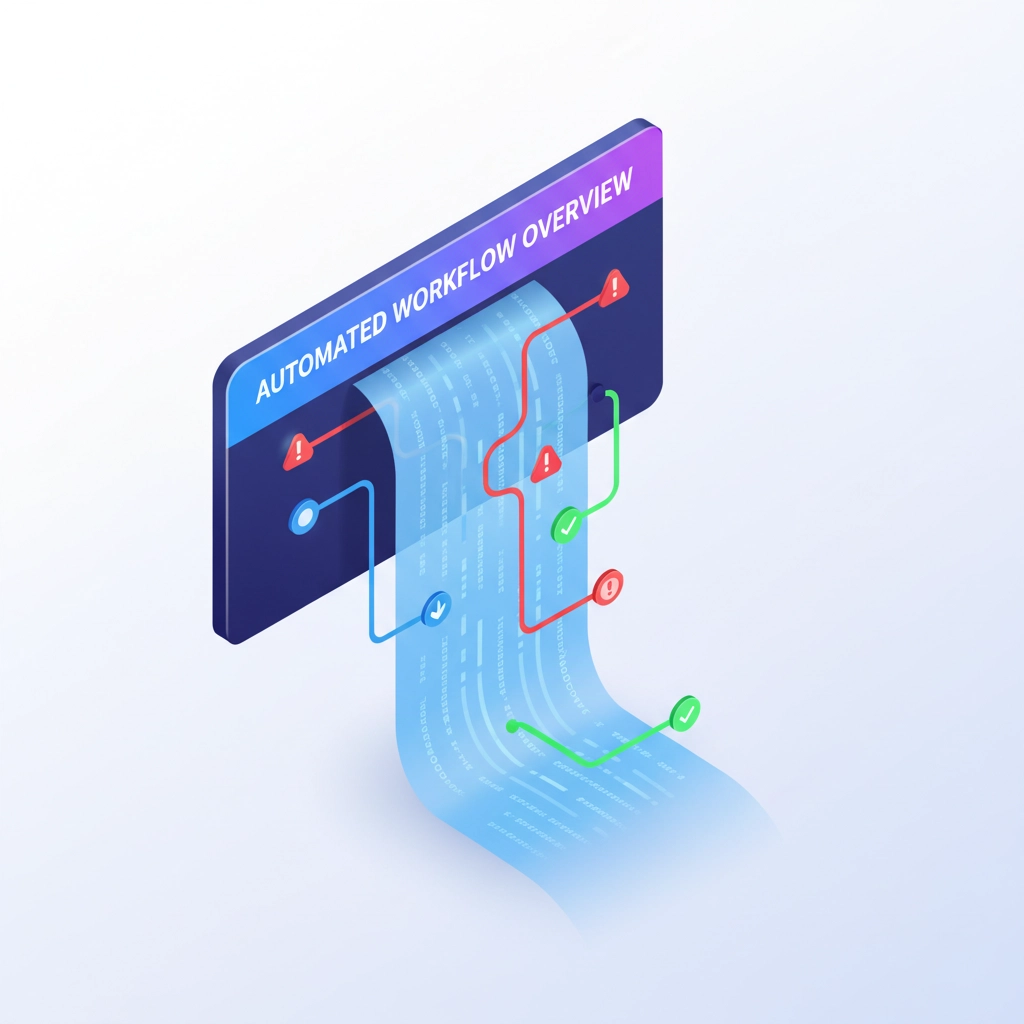
To access execution logs, navigate to your workflow's execution history in the n8n interface. Click on any execution to see the step-by-step breakdown. When troubleshooting, look for red error indicators and examine the exact error messages returned by APIs or services. This transparency transforms debugging from guesswork into a methodical process where you can trace problems to their source.
The execution log also reveals performance bottlenecks. If certain nodes consistently take longer to complete, you might need to optimize API calls, adjust timeout settings, or implement retry mechanisms. Regular review of execution logs helps you understand normal workflow behavior and quickly identify anomalies.
Setting Up Google Cloud Logging for Scale
When managing multiple workflows or processing high volumes of data, n8n's built-in logs may not provide sufficient depth or retention. Google Cloud Logging offers a scalable solution that centralizes all your workflow logs in one searchable location.
Setting up Google Cloud Logging requires creating a Firebase project in the Google Cloud Console and configuring the logging integration within your n8n instance. Once connected, all workflow executions automatically generate structured logs that include execution IDs, workflow names, node details, and custom metadata you define.
The real power of cloud logging emerges when you start creating custom log entries within your workflows. Use HTTP Request nodes or dedicated logging nodes to send specific events, errors, or business metrics to your cloud logging system. This approach lets you track business-level KPIs alongside technical metrics.
Structured logging also enables advanced filtering and alerting. You can set up automated notifications when specific error patterns occur, track workflow performance trends over time, and create dashboards that give stakeholders visibility into automation health without requiring technical expertise.
Implementing Prometheus Metrics for Production Monitoring
For enterprise-level monitoring, Prometheus provides comprehensive metrics collection that goes beyond basic execution logs. N8n exposes several key metrics that reveal the health and performance of your automation infrastructure:
- n8n_execution_total: Total number of workflow executions across all workflows
- n8n_execution_duration_seconds: Histogram showing how long workflows take to complete
- n8n_execution_failed_total: Count of failed executions for failure rate analysis
- n8n_workflow_total: Total number of workflows in your instance
- n8n_credential_total: Number of credentials configured (useful for security auditing)

Beyond application metrics, monitor infrastructure metrics like CPU utilization, memory consumption, and disk I/O. High resource usage often indicates inefficient workflows or the need for infrastructure scaling. Database connection pools, queue depths, and cache hit rates provide additional insights into system performance.
Configure Prometheus with appropriate scraping intervals: typically 15-30 seconds for production systems. Enable default metrics at minimum, and add custom metrics for business-specific KPIs as your monitoring strategy matures.
Health Checks and Automated Alerting
Effective monitoring requires proactive alerting that notifies you of problems before they impact users. Implement liveness and readiness probes to ensure your n8n instance remains healthy and responsive. These lightweight checks run continuously and can trigger automatic remediation or failover procedures.
UptimeRobot integration provides another monitoring layer focused on external service availability. Create workflows that periodically check critical APIs, databases, and web services your automations depend on. When dependencies fail, the monitoring workflow can automatically disable affected automations or switch to backup services.
Set up Prometheus alerting rules that trigger on metrics thresholds. Common alerts include execution failure rates exceeding 5%, average execution time increasing by 50% over baseline, or system resource utilization above 80%. Configure alert routing to send notifications through email, Slack, PagerDuty, or your preferred incident management system.
Best Practices for Monitoring Implementation
Start with comprehensive logging by adding context to every workflow execution. Use Set nodes to capture timestamps, execution IDs, and business context that makes logs searchable and meaningful. Store execution records in databases or spreadsheets to create queryable audit trails for compliance and analysis.
Test monitoring systems before they're needed. Regularly verify that alerts fire correctly and notification systems work as expected. Create runbooks that document response procedures for common alert types, ensuring consistent incident response regardless of who's on duty.
Implement monitoring at multiple layers: application level (workflow executions, API performance), infrastructure level (system resources), and business level (KPIs relevant to your operations). This multi-layered approach prevents blind spots and ensures comprehensive coverage.

Monitor user-facing metrics alongside technical metrics. Track business outcomes like customer satisfaction scores, processing times, and error rates that directly impact your organization's objectives. Technical metrics matter, but business metrics determine whether your automation strategy succeeds.
Scaling Your Monitoring Strategy
Begin with n8n's built-in execution logs and gradually implement more sophisticated monitoring as your automation infrastructure grows. Small teams might rely primarily on execution logs and basic alerting, while larger organizations benefit from comprehensive observability platforms.
Consider the total cost of ownership when selecting monitoring tools. Cloud-based solutions offer convenience and scalability but may become expensive at high volumes. Self-hosted Prometheus and Grafana provide more control and lower ongoing costs for organizations with technical expertise.
Regular monitoring system maintenance ensures continued effectiveness. Review alert thresholds quarterly, archive old logs according to retention policies, and update monitoring configurations as workflows evolve. Outdated monitoring can generate false positives or miss real problems.
How Virtual Nexgen Solutions Can Help
Implementing comprehensive workflow monitoring requires expertise in both n8n automation and observability best practices. Many organizations struggle with the complexity of setting up monitoring systems that provide actionable insights without overwhelming operations teams with false positives.
Virtual Nexgen Solutions specializes in AI and virtual assistant services that include automation monitoring and maintenance. Our team can design monitoring strategies tailored to your specific workflows, implement alerting systems that scale with your business, and provide ongoing support to ensure your automation infrastructure remains reliable.
Whether you're just starting with n8n automation or managing complex workflow ecosystems, our experts can help you implement monitoring solutions that provide genuine peace of mind. We understand the unique challenges facing operations managers and IT teams, and we've developed proven approaches that reduce monitoring overhead while improving automation reliability.
Don't let monitoring complexity prevent you from achieving automation success. Schedule a consultation to discuss how Virtual Nexgen Solutions can help you implement monitoring systems that keep your workflows running smoothly while providing the visibility you need to optimize performance and prevent costly downtime.
Effective workflow monitoring transforms automation from a source of anxiety into a reliable business asset. With the right monitoring strategy, you can confidently scale your automation initiatives knowing that problems will be detected and resolved before they impact your operations.


